
Why a Map Is Not a Network
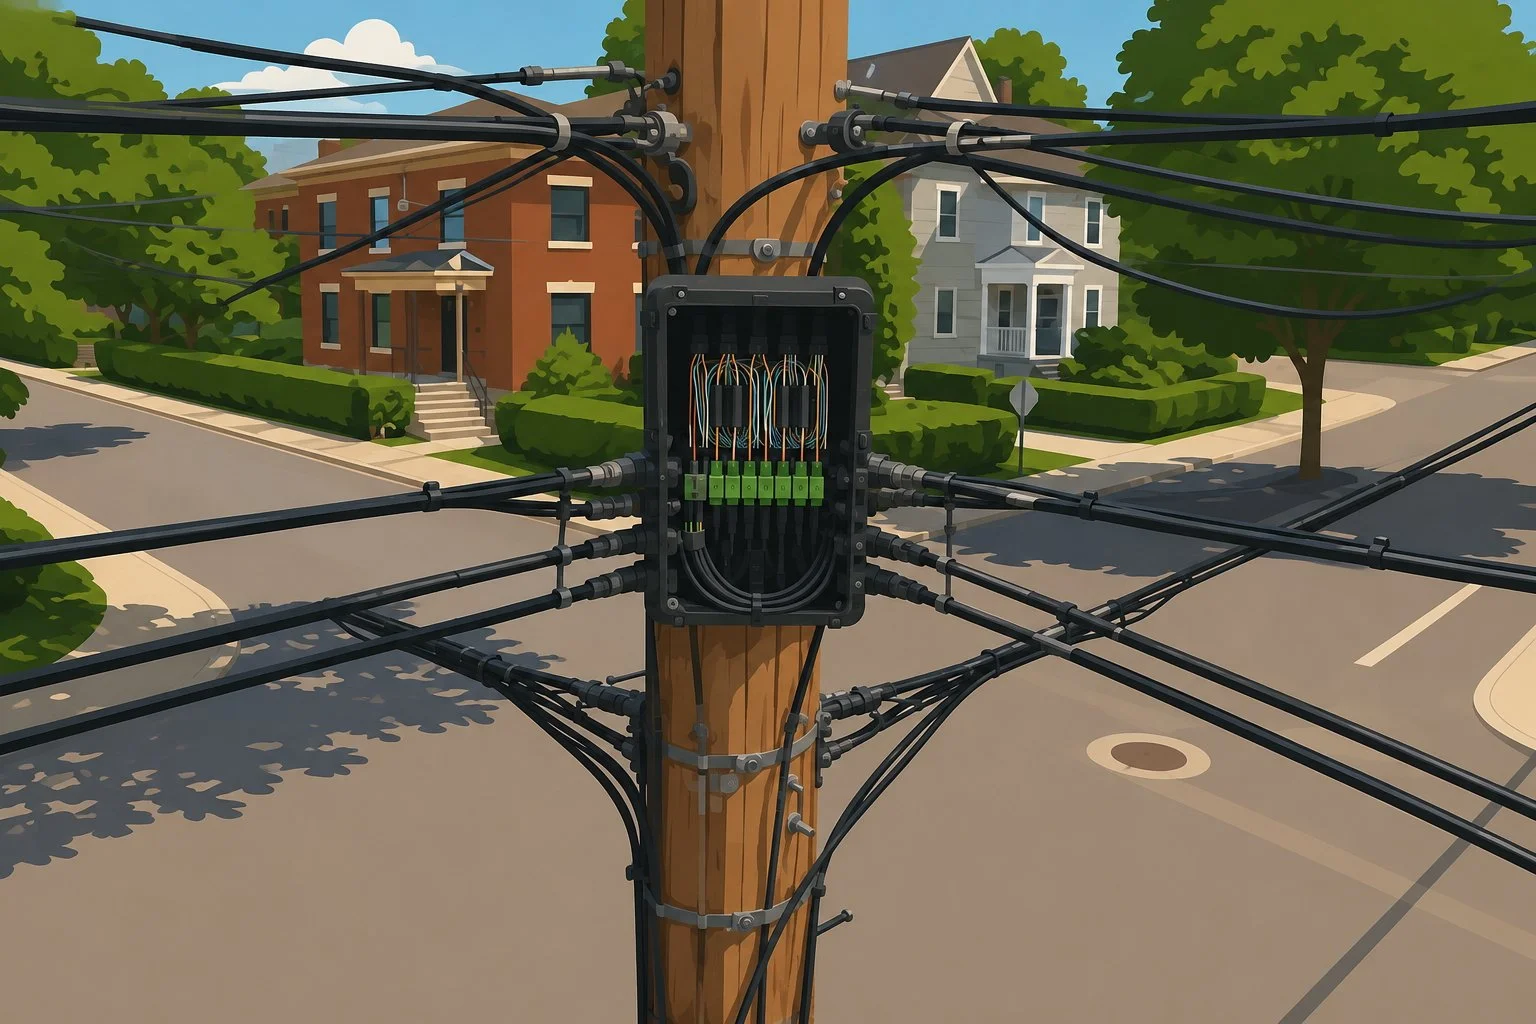
A technician receives a work order: an intervention is scheduled on a specific cable, in a specific area. Before heading out, he asks the most natural question there is:
"If we work on this cable, which customers will be affected?"
The network map opens on screen. It's precise, up to date, well drawn. It shows exactly where the cable is, down to the meter.
But it doesn't answer the question.
When this information isn't available, teams often have to mentally reconstruct network connectivity from plans, documents, or knowledge held by a few key people. This research can take minutes, sometimes hours, while an intervention is already underway, an outage is affecting customers, or a team is about to cut the wrong fiber.
The same scenario repeats itself in different forms, almost every day, in almost every organization operating a fiber optic network:
"Is this address serviceable?"
"How much capacity is left in this area?"
"What equipment depends on this coupler?"
In each of these cases, knowing where the infrastructure is located isn't enough. It's often at this exact moment that an organization discovers a map and a network are two different things, and that confusing the two can be costly.
A Map Answers the Question "Where?"
A map is a valuable tool. It lets you visualize, at a glance, the cables, enclosures, chambers, poles, and equipment that make up the infrastructure. It answers a fundamental question: where is each asset located?
For an organization that previously managed its data on paper plans or in scattered files, having a reliable map already represents a huge gain. It's an essential foundation.
But this information only represents part of the network's reality. It shows where the pieces are, not how they fit together.
A Network Answers the Question "How?"
Two assets can appear side by side on a map, separated by a few centimeters on screen, without being connected, without playing the same role, and without having the same impact if something goes wrong.
What makes a network isn't simply the presence of assets. It's the relationship between them.
Fiber optics illustrates this principle particularly clearly, because its entire operation relies on connectivity: cables, fibers, splices, couplers, equipment, customers; every element exists in relation to the others.
A map shows the components.
A network shows its dependencies.
This is precisely the distinction that sets a specialized GIS for fiber optic networks apart from a simple mapping tool. At Zonedge, this distinction has been at the core of the platform from day one.
Why Fiber Networks Are Different
Not all infrastructure depends on other infrastructure in the same way.
A fire hydrant is independent. It can be moved, replaced, or removed without affecting anything else around it.
A streetlight is relatively independent. Its operation affects, at most, a few meters of sidewalk.
Fiber optics doesn't work this way.
A fiber carrier services. It serves specific, identifiable customers. It depends on other equipment upstream, a coupler, a splice, a cable, and it is itself a dependency for other equipment downstream. Cutting a single point along this path is never an isolated event: it triggers a chain of consequences that ripples both up and down the network.
It's this reality of dependency chains, rather than isolated points, that makes connectivity essential in a fiber optic network. Geography alone never tells the whole story.
Take a simple example. A team needs to replace a coupler in a residential area. On the map, this coupler appears as one piece of equipment among hundreds of others, a point, like all the other points.
But behind that equipment may be 32, 64, or 128 customers.
So the question isn't just "Where is the coupler?"
The question is "Who depends on it?"
This is exactly the kind of answer a map alone cannot provide.
Two networks might even look identical on a map. The same cables. The same enclosures. The same equipment. Yet one can keep functioning despite an outage, while the other instantly loses hundreds of customers.
The difference doesn't show up on the map.
It lives in connectivity.
Questions a Simple Map Cannot Answer
This is where the limits of a map become concrete, in the daily work of teams operating a network:
Which customers depend on this fiber?
What's the impact of a cut at this point?
How much capacity remains available on this segment?
Is there a backup route?
Which services run through this equipment?
Which fiber is the best available option for a new connection?
In Zonedge, these questions can be explored directly from the network's connectivity model, without having to manually reconstruct the dependencies between assets, down to optical paths, loss calculations, and redundancy analysis, notably through tools like Pathfinder.
These are exactly the questions operators ask themselves every day, both in the office and in the field. And none of them can be reliably answered through a simple location exercise. They require understanding how the network is built, and how its elements depend on one another.
What Connectivity Changes Day to Day
When connectivity is modeled correctly, teams no longer just see the network. They can query it.
They can identify customers affected by an intervention, check available capacity for a new connection, analyze optical paths, understand dependencies between equipment, and plan work with greater confidence.
The network stops being a collection of geographic assets. It becomes a source of operational information.
When Connectivity Becomes Essential
It's not during network design that the absence of connectivity is felt.
It's when a fast answer is needed to an operational question.
An outage. An intervention. A new connection. A customer request.
The faster answers need to come, the more essential connectivity becomes. What could once be managed through memory or individual experience eventually becomes impossible to keep up with, without the right tool.
This Is Exactly What Zonedge Models
Zonedge wasn't designed as a GIS that simply draws lines on a map. Zonedge was designed as a platform that understands the network, meaning it models not only where assets are located, but how they're connected to one another.
This understanding spans the entire network lifecycle through three complementary environments:
Zonedge GIS, for network design, inventory, connectivity, and documentation.
Zonedge Web, for consultation, analysis, and oversight, where teams can query the network and get real answers to operational questions.
Zonedge Terrain, for field access, updates, and real-time documentation, right where the work happens.
The key point is this: in Zonedge, assets aren't just mapped. They're linked within a model that represents how the network actually functions. This difference is what makes it possible to answer, in seconds, questions that would otherwise take hours, or that would simply go unanswered. It's what lets teams get the answers they need to plan, intervene, and operate the network with greater confidence.
Conclusion
A map shows you where your network is.
A connectivity model lets you operate it, evolve it, and act on it with confidence.
And when it comes time to answer an operational question, plan an intervention, or understand the impact of a decision, that difference becomes fundamental.
Because in the end, a fiber optic network isn't a collection of lines on a map.
It's a network of relationships.
And this operational understanding is exactly what Zonedge puts in the hands of design, operations, and field teams.
Knowing where an asset is located is useful.
See what Zonedge can do when you also understand what depends on it. Request a demo!
