
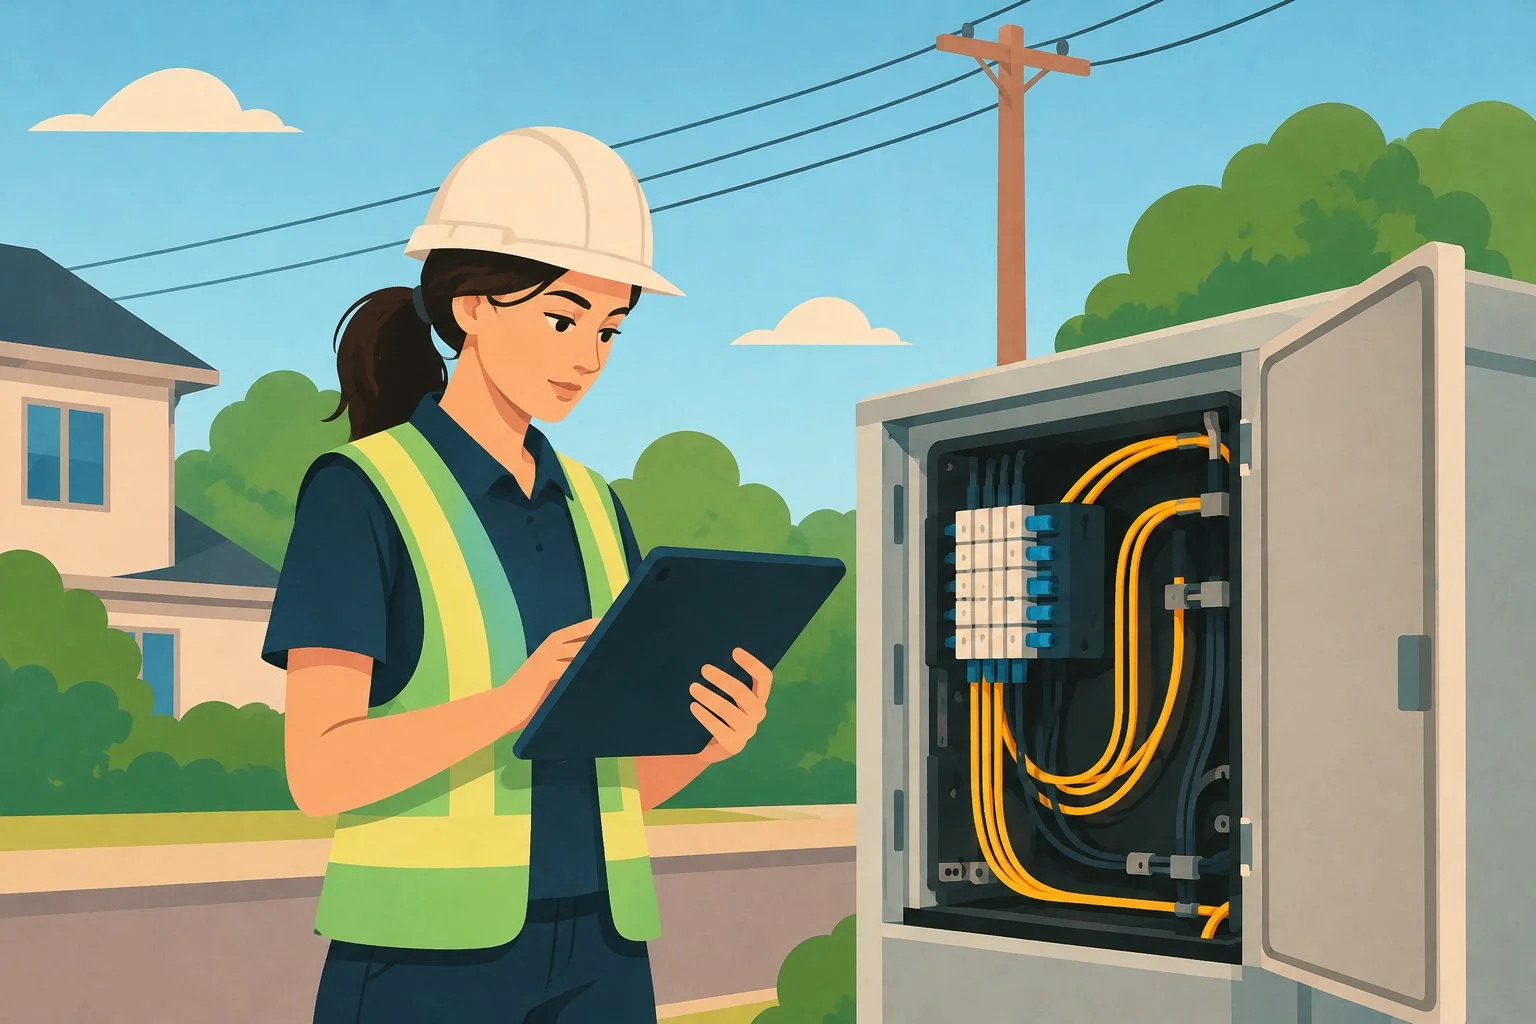
Wednesday morning, 8:30. Sarah, a technician at an independent operator, opens her network map before heading out to a job site. The cable routes are there. So are the enclosures. So are the streets they run through. Everything looks clear.
Then she arrives at the splice enclosure, and the questions begin. Which cables are connected here? What path does the connection take to reach the customer? Which equipment depends on this section of the network? Where are the notes from the last intervention?
The map gave her part of the answer. For the rest, Sarah will dig through PDFs or call Marc at the office, hoping he remembers. Knowing where a cable runs is not the same as knowing how the network works.
November 18 is GIS Day, dedicated to geographic information systems. It’s a good occasion to ask what mapping does very well, and what it can’t do on its own.
The map is essential. But it doesn’t tell the whole story.
Let’s be clear: a GIS is indispensable. For a fiber optic operator, it’s what makes it possible to locate cables and enclosures, plan deployments, pinpoint work sites and see where each piece of infrastructure is installed. No one should go without one. But not all networks have the same needs. A road network, a water network and a fiber network are not the same reality. Geography matters in all three cases, but a fiber network also requires representing its connections, its splices, its connection paths and the relationships between its equipment. A GIS specialized in fiber is designed to build these particularities into network management.
To understand the difference, let’s take a concrete example: connectivity.
A map can show two cables crossing on screen without that meaning they’re connected. It can display an enclosure without, on its own, giving a complete picture of the connections inside it. What you see is geometry. What you need to understand is connectivity.
Take a cable that runs along a street, passes through several enclosures and serves different areas. On the map, you can follow its route easily. But to trace the path of a connection, know which pieces of equipment are linked to each other, or assess what will be affected if you modify a section of the network, you need the links between the elements, not just their position.
Picture a paper map showing cable routes and enclosures. You can follow the infrastructure geographically, but you don’t necessarily have the full logic of how it’s all connected. A specialized GIS like Zonedge goes further by linking the geographic representation to the network’s actual connectivity.
When information is scattered, every intervention becomes an investigation
Even with an excellent map, a team loses time when the rest of the information is stored elsewhere: PDFs, Excel files, photos on a phone, job site notes, individual folders. Before they can move forward, the technician has to piece together the picture of the network, like a detective gathering clues.
This has three very concrete effects. Searches take longer, because you have to find the right version of the plan and confirm the details. Decisions get harder, because a map and a document don’t always tell the same story. And information degrades over time: what was changed in the field doesn’t always make it everywhere it should.
Take a municipality that manages its network with three employees who take turns, each keeping their own files. When an intervention is completed, the information needs to end up in the right documents so the others can take it into account. Otherwise, the field and the office risk working with different versions of the network. The challenge, then, is not just having an accurate map, but maintaining a consistent representation of the infrastructure, its connections, and the changes made to it.
A GIS built for the reality of fiber optics
That’s precisely what Zonedge offers: a GIS specialized in fiber optics that brings together, on a single platform, infrastructure mapping, connection logic, network inventory and change history. You get a geographic view of your network, with its cable routes and enclosures, but also the information you need to understand how the infrastructure is connected, what it’s made of and how it evolves over time.
Let’s take it question by question, like Sarah standing in front of her enclosure.
“What’s installed here?” The network inventory tells you which infrastructure is in place, without having to guess from a symbol on a map.
“What is it connected to?” Connectivity shows you the links between elements and the paths each connection follows. No more piecing a route together by hand.
“What has changed since the last intervention?” Documentation and change history answer that. An intervention photo linked to the right network element, for example, helps you see what was actually done in the field, not what someone thinks they remember.
“Does the office see the same thing I do?” And this may be the most important question of all. The office team, the field team, and management can all work from a single representation of the network. Once Sarah’s change is saved in the platform, Marc can see the updated information at the office. No one needs to text anyone to confirm what was done. Each team has the information it needs to understand the network and contribute to managing it.
Fiber deserves a GIS designed for it
A GIS is a fundamental tool for managing a fiber optic network. But to get the most out of your network, you need more than its geographic representation: you need to understand the connections, know what infrastructure is in place and be able to find the history of changes.
That’s where specialization makes the difference. With Zonedge, mapping, connectivity, inventory and history all live in one environment, designed around the specific needs of fiber optic networks.
A fiber network is not just cables on a map. It’s a set of connected infrastructure that you need to be able to understand and manage every day.
If your technicians still call the office to trace a connection, you already know where the gap is. GIS Day, on November 18, is a good time to start closing it. Ask for a demo of Zonedge!
