
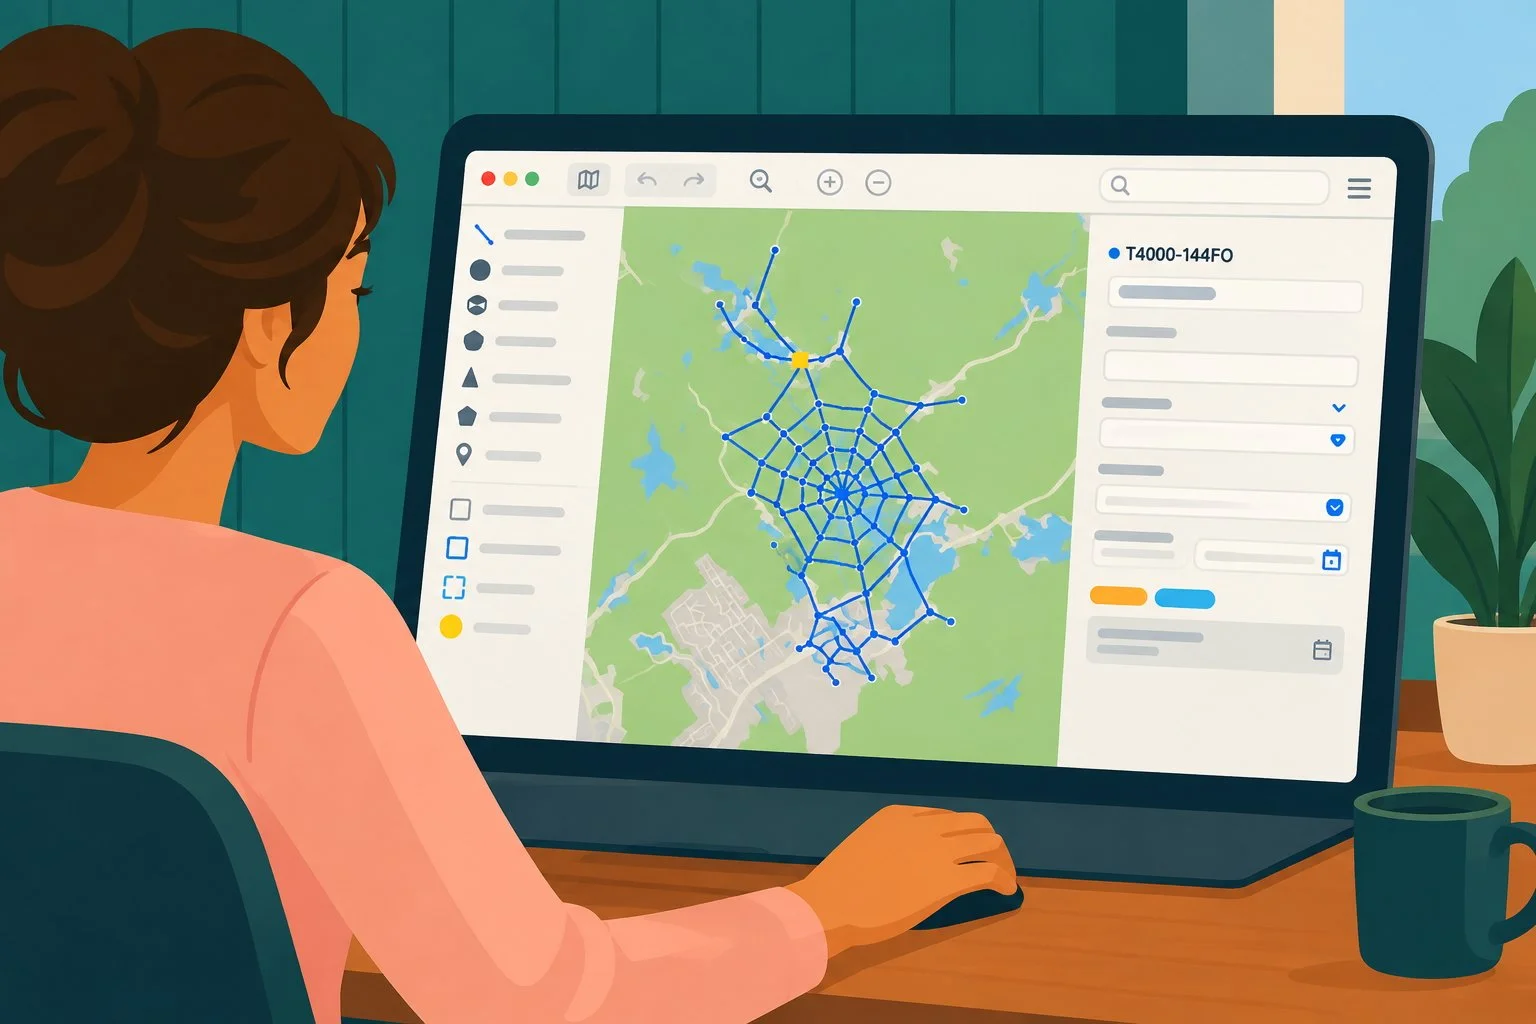
Seen from a distance, a spider web looks perfectly simple, and a fiber optic network on a map gives the exact same impression. But up close, you find crossings and anchor points where pulling a single thread shifts the tension everywhere else.
A traditional map shows where the cable is, but it completely ignores the logic of the system. The result: information scattered across AutoCAD drawings, Excel files, splicing PDFs, and the memory of long-time employees.
In this presentation, we explain how Zonedge models these relationships by linking connectivity, capacity, history, and field data. When a team adds a geotagged photo, the information is automatically woven into the overall understanding of the network.
A network’s complexity doesn’t come from the miles of cable, but from all the relationships that connect them. Ready to move from a static map to dynamic modeling and weave your own web to success? Request a demo!
