
Halloween is approaching.
Decorations are going up, spiders are taking over shop windows, and webs are multiplying everywhere.
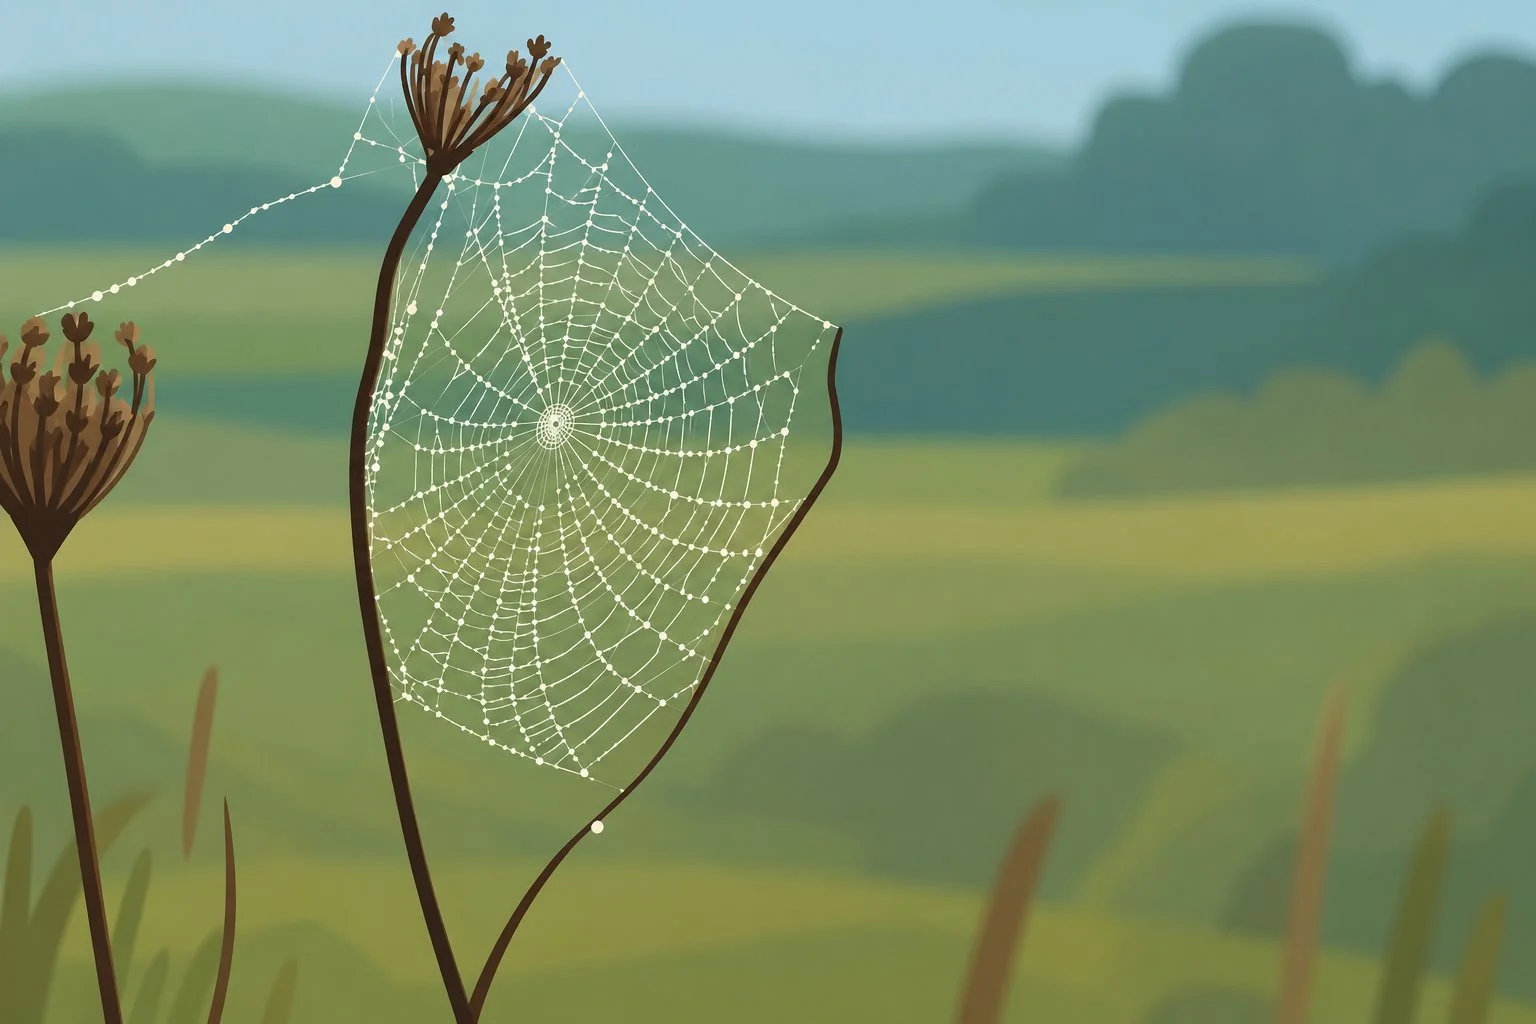
From a distance, a spider web looks simple: a few threads stretched between two points.
A fiber optic network often gives the same impression. On a map, it looks like lines, boxes, and addresses.
But in both cases, that simplicity only lasts as long as you keep your distance.
From a Distance, Everything Looks Simple
A network map, like a web seen from afar, gives an impression of clarity.
Lines that represent cables. Points that represent boxes. Addresses that represent customers.
Everything seems to be in its place. Everything seems understandable at a glance.
Up Close, Everything Is Connected
Move closer to a spider web and the picture changes completely.
Each thread joins several others. There are crossings, paths, and anchor points that the entire structure depends on.
A fiber network works in exactly the same way. Each cable connects to equipment that, in turn, serves other parts of the network and other customers, often through more than one possible path.
These are not isolated objects sitting side by side. They are relationships. Pull on one thread and the tension shifts elsewhere in the web. In a network, it’s the same: a cable is connected to equipment, fibers, customers, and sometimes to protection routes that depend on one another.
A change in one place almost always ends up meaning something somewhere else in the network.
It is this structure of relationships, more than the objects themselves, that determines whether a network works or not.
This Is Where Most Tools Reach Their Limits
A map, like a photo of a web, shows objects. It doesn’t show how they hold together.
It answers the question “Where?” well. It rarely answers the questions that follow:
How is everything connected? Who depends on what? How does information flow through the network?
A map shows the geometry of the network. It doesn’t show its logic.
And that logic doesn’t live in one central place. It is scattered across AutoCAD drawings, Excel files, splice PDFs, and the memory of those who have known the network for a long time.
Zonedge Was Built Around Relationships
That is precisely the gap Zonedge exists to close.
Rather than treating the map, connectivity, history, field interventions, customers, and capacity as separate pieces of information, Zonedge treats them as different views of the same web.
Connectivity reveals how assets are linked to one another. Capacity makes it possible to understand what a given area can still absorb. History preserves the memory of past interventions, while field data reflects the real, day-to-day state of the network. Together, this information describes different facets of the same reality.
For example, when a new address needs to be connected, the team needs to know not only where the customer is located, but also which fibers are available, which path the service will take, how much capacity remains in the area, and what changes have already been made nearby. All of this information is part of the same web. With Zonedge, it is already connected.
When a field team updates a box or adds a geotagged photo after an intervention, that information doesn’t stay isolated in a report. It becomes part of the overall understanding of the network.
That is why Zonedge doesn’t just map a network’s assets. It also models their relationships and keeps them up to date as the network evolves.
A team that qualifies a new address, plans a connection, or assesses the capacity of an area is then working from a single, shared understanding of the network, whatever hat they happen to be wearing that day.
Understanding the Whole Web
A spider web is never truly simple. It only gives that impression until you look closely.
A fiber optic network is no different. Its complexity comes not from the number of cables, but from the number of relationships that bind them together.
Because a fiber network is not a collection of lines. It is a living system where every element is connected to the others.
A map shows where the network is. Zonedge shows how it holds together.
Because a spider web is not just a collection of threads. Neither is a fiber network.
Ask for a demo of Zonedge!
